


On May 5th and 6th, Blue Yonder, the former JDA, had their annual user conference. The pandemic led to its being held on-line. I’ve previously written about the benefits BD receives from their real-time control tower in terms of being able to serve their customers better – including hospitals desperate for medical supplies during this pandemic – and new supply chain efficiencies.
BD, with annual revenues of more than $17 billion, is a leading global medical technology company. They offer with a broad set of products. This includes solutions used in COVID-19 research, a product that tests for COVID-19, and many other products used for treating hospital patients. 90 percent of those in the US who go into a hospital will encounter a BD product.
Two speakers from BD spoke at the Blue Yonder ICON conference. This article is based mainly on the presentation of David Baitman on May 6th. Mr. Baitman is the BD Control Tower Lead. The control tower was built using the Blue Yonder platform.
The Scope of the Control Tower Project
In any significant IT project, the scope needs to be clearly defined. The requirements were gathered from various business units and supply chain functional areas including logistics and planning. Effectively managing inventory is at the heart of supply chain management. BD bucketed inventory management into three categories: inventory at rest, inventory in motion, and hot items.
Inventory at rest was based on products located at BD manufacturing plants and BD’s distribution centers. This type of visibility includes the current stock picture across the network, what customers want to purchase, what stock is expiring, what supply orders are outstanding.
Inventory in motion includes what is moving between, in, or out of each location, what is on each truck, ocean container, airplane, or rail car as well as whether the shipment is early, on time, on time but not received, or late.

When it comes to hot items, Mr. Baitman pointed out that the trick is to identify what is “news” and what is “noise.” Perhaps a truck is late, but it contains product where BD has plenty of stock. On the other hand, an ocean container might come in early but contain products that are in a low stock position. “So, we want the system to tell us which to receive first.”
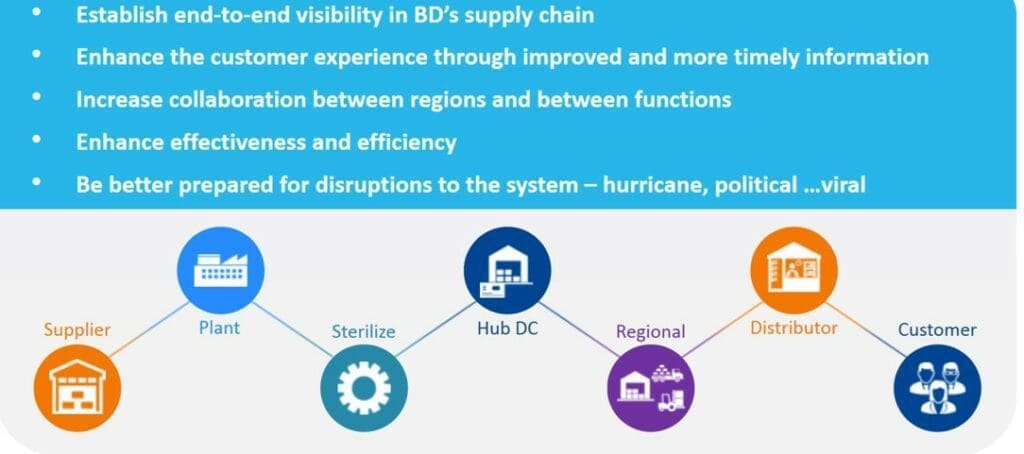
The company is building their control tower in three phases. The first phase was to support visibility from a BD plant to a BD distribution center, the second phase is from the BD warehouse out to the customer, and the third phase will be visibility of supplier shipments into BD facilities and internal manufacturing processes. They have finished phase one and are well into phase two.
An Agile Implementation Process
Using an agile implementation methodology, they do work in short sprints. Sprints are small manageable blocks of work that deliver capabilities sought by their users. Mr. Baitman believes that the increased frequency of collaboration and feedback at the heart of this methodology, results in two advantages. Those advantages include more rapid implementation of functionality valued by users and faster detection of issues and defects.
Further an agile implementation process increases flexibility. Because they employed this methodology, they were able to pull functionality needed during this pandemic up in the project timeline.” This feature set allows BD to track critical pandemic medical products shipped via FedEx to customer locations.
The project plan involved an understanding of what problems the company was trying to solve and tackling high value problems first. The requirements definition and project plan were based on an understanding of which requirements helped solve high value problems and then tracking the value associated with solving those problems. Value capture was built into the design of the project because BD needs to be able to tie actual savings to what was promised.
Data, Data, Data: The Heart of a Control Tower
BD built a data lake that consumes all the critical data from the ERP databases. This cloud-based database is hosted by Microsoft Azure. BD chose to replicate the data using database logs rather than pulling the data from the applications. They used a product called Qlik Replicate (formerly Attunity Replicate) for this. The data lake approach also provides a degree of future proofing.
There was significant work with the business users to generate a harmonized data layer. The critical master data for supply chain management includes sales orders, shipments, inventory, and lanes. Different business systems can define all the fields associated with these forms of master data differently. But BD took these objects and asked their business users what data points they needed for each of these objects. The BD team did not care what various business systems, like SAP, thought the object looked like. Harmonizing data is a difficult task. Companies need to give themselves plenty of time to work through these issues.
Two sets of core functionality include being able to understand what BD’s current inventory position is and tracking shipments. To understand the current inventory position, BD took the initial stock position and then calculated how that inventory position is changed by things like quality inspections, purchase orders, production orders, and intercompany demand. This generates visibility to in-stock inventory at a specific location.
In terms of tracking shipments, carriers needed to be on boarded. Mr. Baitman said “all carriers are not created equal. Some are more willing to provide data. Some are more able.” In order to track shipments, carriers reference numbers needed to be tracked. If it is not possible to track a carrier’s shipment with a tracking number on the carrier’s website, it almost certainly can’t be tracked in the control tower. Further, BD itself may need to change processes to make sure those tracking numbers are captured in a business system.
It is not viewed as the control tower team’s job to clean up all data issues. The core systems may need to be fixed or a regional team or business unit may have to change processes to improve the quality of the data.
Control Tower’s Need to Provide Actionable Information
BD also built key performance indicators (KPIs) to be used in the platform. The KPI work included deciding which key performance metrics were needed, and then aggregating data from all the different forms of master data – deliveries, inventory, orders, etc. – and then applying the right math to that data. By building KPIs in this way, users have a view not just into performance, but this architecture allows users to have the ability to drill into the data to better understand the root cause of an issue.
To make the information actionable, BD built playbooks. Playbooks are based on common scenarios – for example late shipments or an unusually large order from a customer – and then figuring out the steps involved in rectifying that problem. BD is also looking to build playbooks for uncommon scenarios – what the company should do in the event of a hurricane, or a port strike, or a pandemic. Building these playbooks is an ongoing activity. Even though it is not known what the completed playbook will look like when the system is being designed, for the system to work well, playbooks do need to be part of the initial design.
Not all problems can be solved by one or two planners. The Blue Yonder platform also allows for the building of situation rooms. In the case of a crisis, like caused by a pandemic, you might even call these ‘war rooms.’ These situation rooms allow for stake holders across an organization to collaborate to solve problems.
Conclusion
The kind of Control Tower that BD has – that integrates planning with logistics data, has real-time visibility to important supply chain events across the end to end supply chain, and provides playbooks and situation rooms for problem resolution – seems almost magical. This kind of holistic solution was just not available a few years ago. This is the technology stack needed to much more tightly tie planning to execution.